Playing around with circuit tracing
The viral prompt “I want to wash my car. The car wash is 50 meters away. Should I walk or drive there?” got me thinking about what happens inside an LLM when it is prompted with a distance and some modes of transport. To study this in a more controlled way I switched to prompts of the form:
“Provide a single word answer. Should I walk/drive to my destination which is {distance} m away.”
and investigated behavior of Qwen3-14B using circuit tracing. There are many more things to test and explore, but here are some curious observations I have made so far.
Setup
I chose the above prompt because it produced consistent behavior with respect to the order (walk/drive vs drive/walk) and the unit format (m, meters, metres).
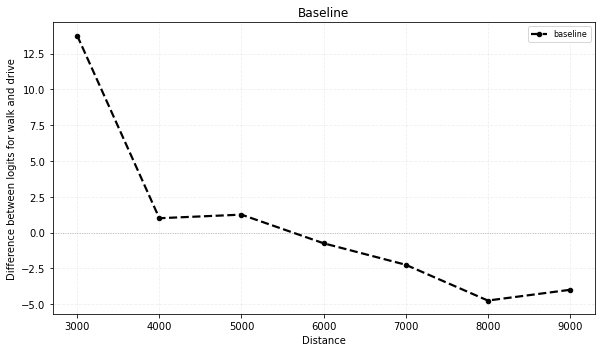
The metric I look at is the difference in logits for walk and drive. I include both lower- and upper-case tokens in the walk and drive categories, i.e.
Logit diff = (logit(‘Walk’)+logit(‘walk’)) - (logit(‘Drive’)+logit(‘drive’)).
In the experiments presented here positive logit difference means preference for walking. Below is a plot of the baseline behavior with logit difference on the y-axis and distance on the x-axis. We can see that with this prompt the switch from walking to driving happens around 6000 meters.
Graph construction
From here I generated three attribution graphs for distances of 3000, 6000, and 9000 meters, which correspond to prompts in the walking regime, around the threshold, and driving regime respectively.
To narrow down the number of features to investigate, I compared the three graphs and identified features that are present in all three graphs (at 80% pruning). I also limited the exploration to tokens starting at the first digit of the distance. Because of causality, only this and subsequent tokens have access to the distance information, so I was hoping that most of the interesting behavior would be in those tokens.
This produced 562 overlapping features. This corresponds to 78.5%, 83.0%, and 84.1% of the features in the relevant tokens in the 3000 m, 6000 m, and 9000 m graphs respectively. I then went through the overlapping features, labeled them, and added the ones that seemed relevant to the subgraph. Many of the overlapping features had to do with general user/assistant question answering as well as instruction following, namely answering with a single word. I did not include them in the subgraph because they do not seem relevant to the walk or drive decision, which is what I am interested in. The features that I did add to the subgraph I then heuristically grouped based on patterns I have observed. Many other features not included in the graph below seemed relevant but I was not able to clearly assign them to a group on my first pass. Another detailed pass over the features would probably lead to more features being included now that I have a better idea of what to focus on. Below is a diagram of the graph with nodes that I have grouped highlighted.
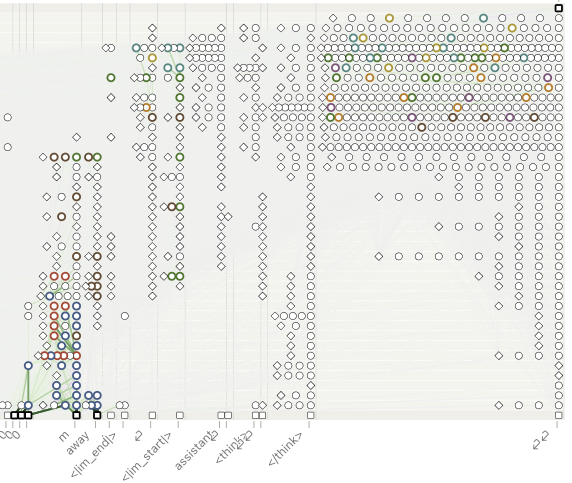
The most relevant supernodes are concentrated around the m, away, <im_start>, ⏎, and ⏎⏎ (answer token). The main supernodes I identified were:
● number with units: from number and m embeddings there is a cluster of features I called “number with units.” In the first couple of layers, features such as meters, metres, as well as general units following some number are present.
● distance with units: in deeper layers the features become refined into more specific distances. I called this group “distance with units.” There are some features that seem to activate at specific distances followed by meters (or feet/miles/kilometers, so there is potential for generalization).
● distance to travel: even deeper into the m and away tokens we start to observe features that activate on traveling some distance or path. There are also some features that activate on math/physics problems related to distance and speed.
● active travel: features that seem to do with running, cycling, and other active forms of travel.
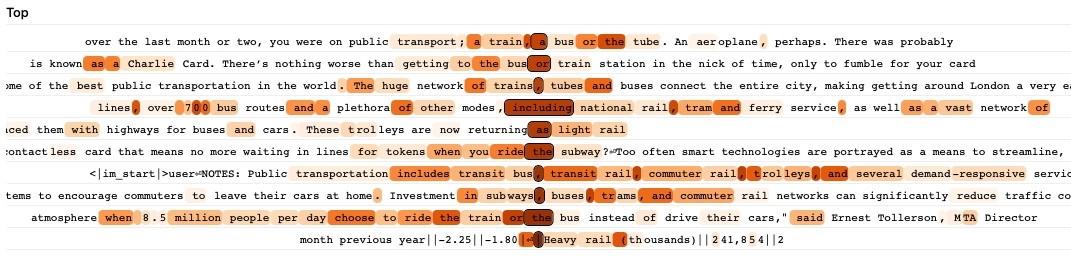
● public transit: features that activate on discussion of public transit, taking public transit, and public transit infrastructure. Below are the highest activation snippets for one such feature. It activates most strongly on tokens preceding words like train, bus, rail, and tube.
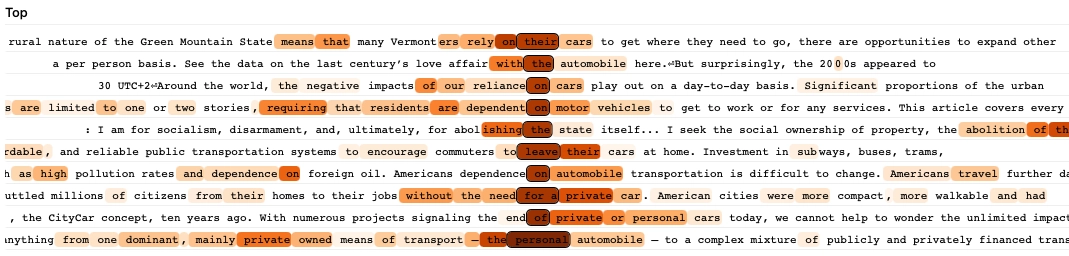
● car dependence: features that activate on snippets about having to use cars, it being difficult to get around without a car, and related ideas. Below are the highest activation snippets for one such feature. It activates most strongly on tokens preceding words like car, automobile, and motor in contexts discussing reliance on cars.
● say walk / ● say drive: features that activate on words preceding walk, drive, or closely related continuations.
Main observation
The observation I have found most interesting is that the interpretable overlapping features are dominated by broader transport-related discussion. At least in these graphs and the features I have inspected (overlap between the three prompts, 80% pruning, only tokens from distance onwards), I did not find many features that looked like explicit representations of a distance being walkable or drivable, or comparison between walking and driving specifically. Instead, the broad picture is that earlier features are mostly about units, distances, and traversing distances by different means. Mid-level features at the answer token are then mostly about broad discussion of different modes of transport, while the more specific walk/drive-related features seem to appear only in the later layers at the answer token.
It should be noted that I have observed some features influenced by distance with units features that seem to correspond to more general notions of large/long and small/short, but there are either not many of them, or they are difficult to interpret based on top activations.
Interventions on supernodes
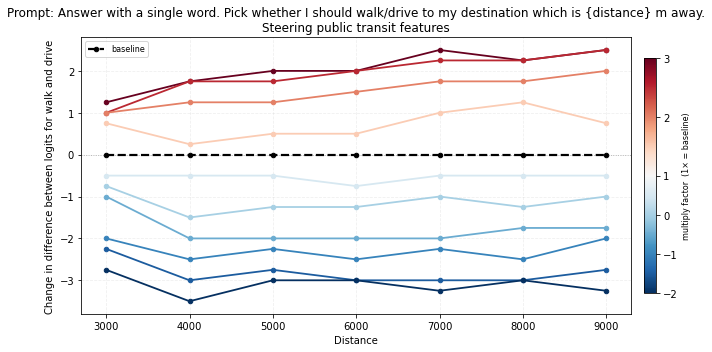
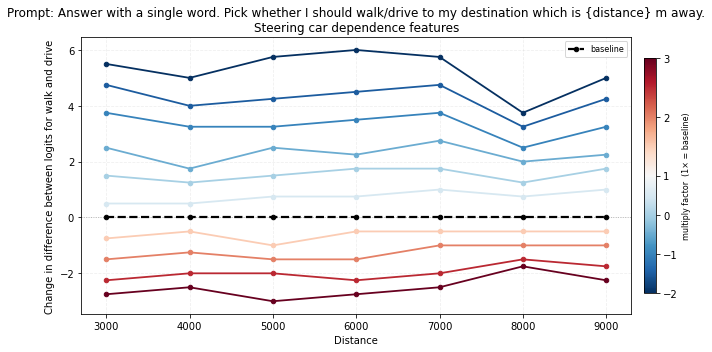
For each supernode, I steer the associated features by scaling the activations of all the features in the supernode by a fixed multiplier. The multiplier can also take on negative values, effectively inverting the direction of the features. I then evaluate and plot the change in the logit difference. The most interesting and consistent intervention results came from the public transit and car dependence supernodes.
In the plots below, positive changes mean steering toward walk, while negative changes mean steering toward drive.
-
Steering public transit: the graph below shows that amplifying public transit features pushes the model toward walk output across the whole distance range, while inverting them pushes it toward drive.
-
Steering car dependence: amplifying car dependence features does the opposite, pushing the model toward drive, while inversion shifts it toward walk.
I also observe that when drive is replaced with cycle (and the distance adjusted accordingly to be around the switchover point), the effect of steering the two supernodes is small and inconsistent. On the other hand, if we replace walk with cycle, the features steer the model toward cycling. This suggests that these features may be encoding broader pro-/anti-driving concepts rather than something specific to walking. For plots see more steering experiments.
Some other supernodes are showing signs of interesting behavior. For example, suppressing distance to travel supernode features seems to lead the model to be less decisive about its choice. But I think other supernodes need to be refined somewhat.
Limitations and next steps
I initially went with the prompt Provide a single word answer. Should I walk/drive to my destination which is {distance} m away. because it resulted in the most consistent behavior across small variations but I later noticed that it has awkward tokenization (drive is tokenized as /dr and ive). Interventions do appear to generalize well to the more natural walk or drive and drive or walk prompts, so for now I treat this mainly as something to watch out for in future work.
I have also so far restricted my attention to features that appear in all three regimes and specifically in 80% pruned attribution graphs. This will select for broad features and may exclude more specific distance-related features.
It should also be noted that significant influence on some interesting nodes comes from error nodes which suggests that some interesting circuit components may be missing from the feature representation captured by the graph.
Some things I am curious to explore next with these kinds of prompts are:
- investigating graphs for prompts that ask the model to choose between cycling and walking, where there should be less influence from driving alternatives features so it would be interesting to see what affects the decision there,
- checking whether the same or similar features are responsible for the behavior in a language other than English,
- and altering the prompt and seeing how the results change (e.g. testing different units such as feet or kilometers, means of transport, and specific destinations; for some of this see more steering experiments).